Market Concentration Analysis 2000-2024

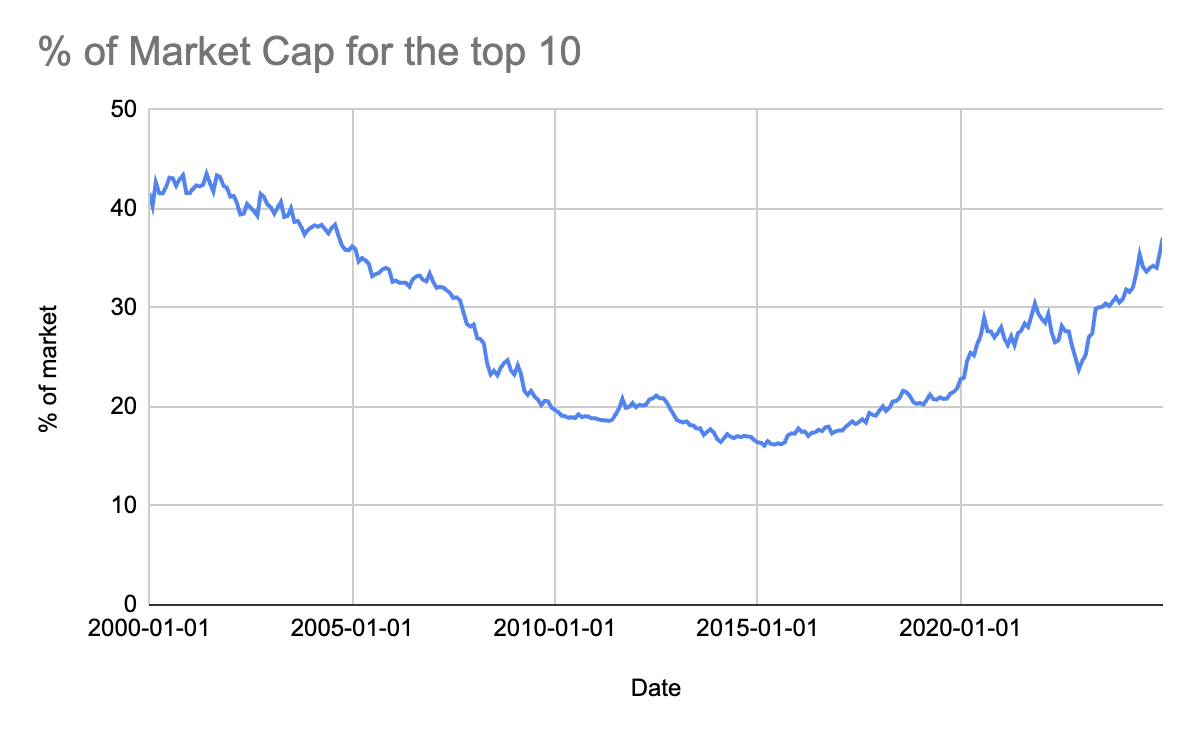
The U.S. stock market has undergone a dramatic transformation from 2000 to 2024, both in size and composition. Starting at $9.36T in 2000, the market cap has grown nearly 6-fold to $52.64T, while experiencing significant volatility during the dot-com crash (-$2.61T in 2002), financial crisis (-$4.52T in 2008), and post-COVID tech correction (-$8.01T in 2022). The concentration of power among the top 10 companies has followed a U-shaped pattern: starting high at 41.60% during the dot-com bubble, dropping to a low of 16.64% in 2014, and rising again to 37.11% in 2024.
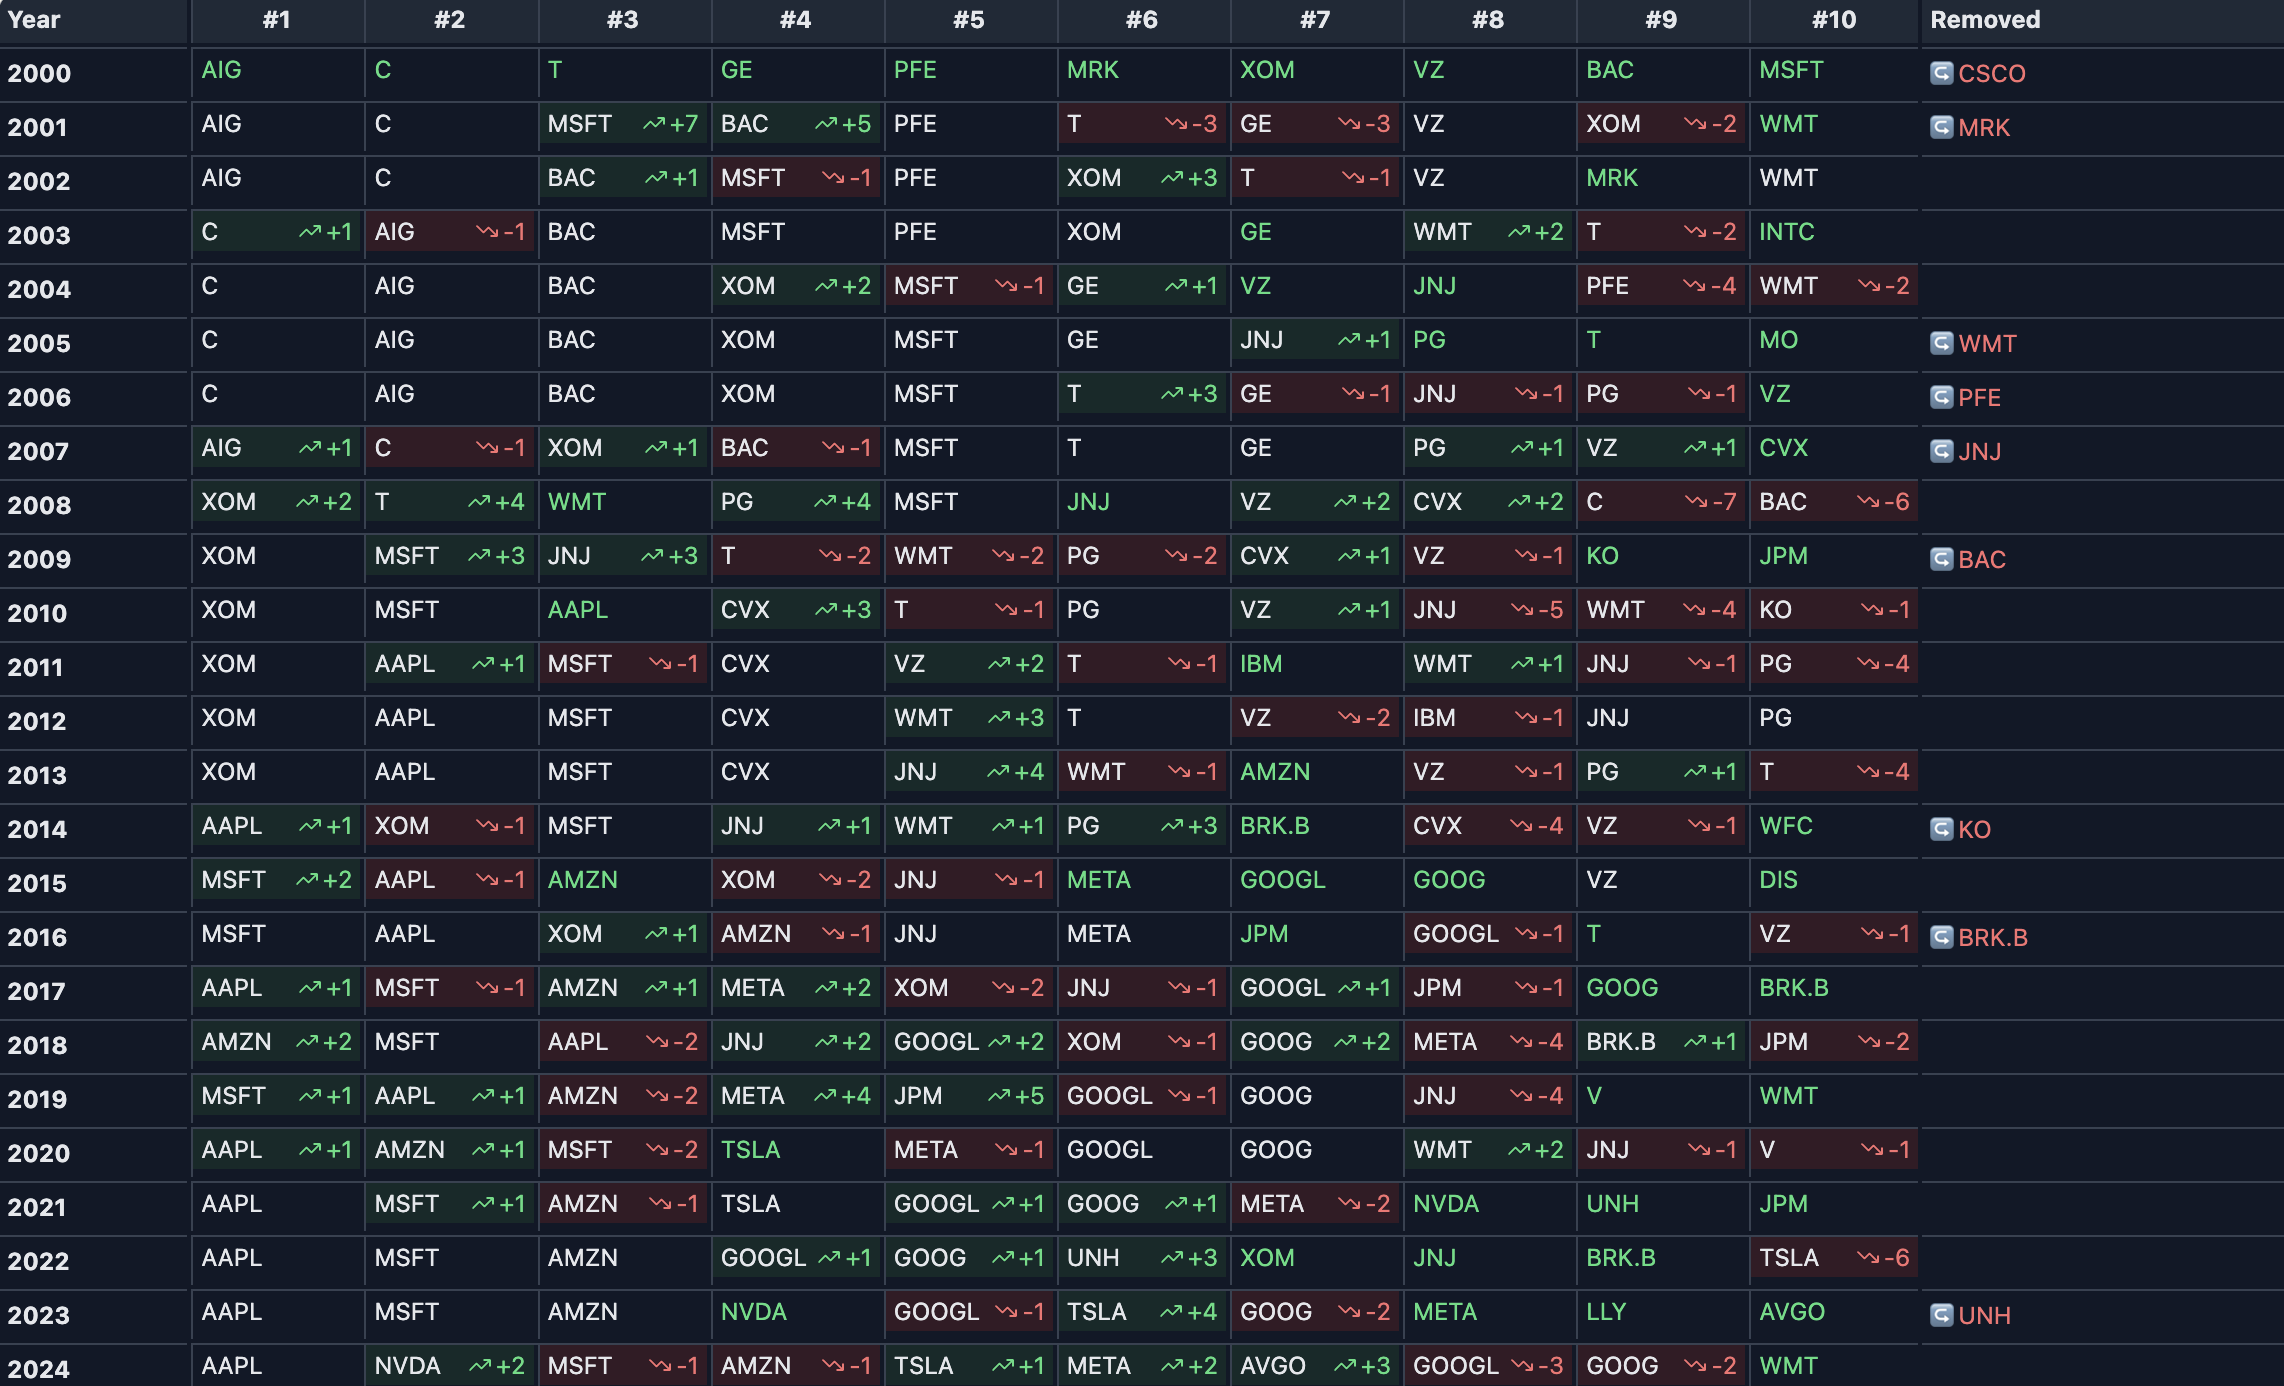
The composition shift has been equally dramatic. In 2000, the market was dominated by financial (AIG, Citigroup), industrial (GE), and telecom (AT&T) companies, with Microsoft as the sole tech representative. By 2024, the market is overwhelmingly controlled by tech giants, with the "Magnificent Seven" (Apple, Microsoft, Amazon, NVIDIA, Meta, Alphabet, Tesla) leading the charge, primarily driven by AI and digital transformation.
This shift reflects three major economic transitions: from physical to digital business models, from regional to global platforms, and from traditional valuation metrics to growth and AI potential. Only Microsoft has remained in the top 10 throughout this entire period, highlighting the massive turnover in corporate leadership as technology has reshaped the economy.

Analysis 2000-2024
Biennial Analysis (2000-2018)
2000
- 41.6%, $9.4T, -$1.2T
- Changes:
- Added: BAC (Bank of America)
- Dropped: CSCO (Cisco)
- Key Reasons:
- Dot-com bubble peak
- Bank consolidation wave (Bank of America growth)
- Telecom/Financial dominance in traditional economy
- Cisco affected by dot-com valuation reset
2002
- 40.5%, $6.8T, -$2.6T
- Changes:
- Added: WMT (Walmart)
- Dropped: GE (General Electric)
- Key Reasons:
- Post dot-com crash flight to safety
- Walmart's expansion in recession economy
- Tech sector continued weakness
- Market seeking stable cash flows
2004
- 35.8%, $9.2T, +$2.5T
- Changes:
- Added: GE, JNJ (Johnson & Johnson)
- Dropped: T (AT&T), MRK (Merck)
- Key Reasons:
- GE's success under Jack Welch leadership
- Healthcare sector growth with aging population
- Low interest rates fueling conglomerates
- Global economic recovery
2006
- 33.5%, $11.2T, +$2.0T
- Changes:
- Added: PG (Procter & Gamble), VZ (Verizon)
- Dropped: PFE (Pfizer)
- Key Reasons:
- Consumer staples strength in growing economy
- Verizon's wireless expansion
- Patent cliff concerns hitting pharma
- Housing bubble driving financial valuations
2008
- 23.7%, $6.7T, -$4.5T
- Changes:
- Added: CVX (Chevron)
- Dropped: AIG (American International Group)
- Key Reasons:
- Financial crisis decimating banking sector
- Oil price spike before crash ($147/barrel)
- Flight to consumer staples safety
- AIG's near-collapse and bailout
2010
- 18.8%, $9.4T, +$2.6T
- Changes:
- Added: AAPL (Apple), KO (Coca-Cola)
- Dropped: C (Citigroup), BAC
- Key Reasons:
- iPhone driving Apple's mobile revolution
- Banking sector's post-crisis struggles
- Coca-Cola's international growth
- Tech beginning to displace financials
2012
- 19.3%, $10.9T, +$1.6T
- Changes:
- Added: IBM (International Business Machines)
- Dropped: KO
- Key Reasons:
- IBM's enterprise software/services transformation
- Cloud computing early growth
- Oil prices driving energy valuations
- Post-crisis recovery gaining steam
2014
- 16.6%, $15.9T, +$5.0T
- Changes:
- Added: BRK.B (Berkshire Hathaway), WFC (Wells Fargo)
- Dropped: IBM, KO
- Key Reasons:
- Berkshire's successful crisis-era investments
- Wells Fargo's mortgage market dominance
- Mobile computing driving tech growth
- QE fueling market expansion
2016
- 17.5%, $18.0T, +$2.0T
- Changes:
- Added: AMZN (Amazon), META (Facebook), GOOGL (Google)
- Dropped: WFC, CVX, PG
- Key Reasons:
- Amazon's AWS and e-commerce dominance
- Facebook's mobile advertising success
- Google's search monopoly strength
- Digital transformation accelerating
2018
- 20.3%, $20.6T, +$2.6T
- Changes:
- Added: GOOG (Google Class C), BRK.B
- Dropped: T, VZ
- Key Reasons:
- Google's stock split creating dual shares
- Tech platform economy dominance
- Telecom losing ground to tech
- Berkshire's tech investments paying off
Annual Analysis (2019-2024)
2019
- 21.9%, $26.8T, +$6.2T
- Changes:
- Added: V (Visa), WMT
- Dropped: XOM (ExxonMobil), BRK.B
- Key Reasons:
- Digital payments revolution
- Walmart's e-commerce transformation
- Oil price weakness
- Rise of fintech over traditional finance
2020
- 27.5%, $32.3T, +$5.5T
- Changes:
- Added: TSLA (Tesla)
- Dropped: JPM (JPMorgan Chase)
- Key Reasons:
- Tesla's EV market dominance
- Pandemic accelerating digital transformation
- Remote work boosting tech valuations
- Banking sector COVID concerns
2021
- 29.4%, $41.1T, +$8.8T
- Changes:
- Added: NVDA (NVIDIA), UNH (UnitedHealth Group)
- Dropped: WMT, V
- Key Reasons:
- NVIDIA's gaming/crypto chip demand
- Healthcare digitalization
- Stimulus-fueled market rally
- Crypto bull market peak
2022
- 23.8%, $33.1T, -$8.0T
- Changes:
- Added: XOM, BRK.B
- Dropped: META, NVDA
- Key Reasons:
- Energy crisis from Ukraine war
- Interest rate hikes hitting tech
- Meta's advertising challenges
- Flight to value stocks
2023
- 30.6%, $41.7T, +$8.6T
- Changes:
- Added: NVDA, META, LLY (Eli Lilly), AVGO (Broadcom)
- Dropped: XOM, JNJ, BRK.B, UNH
- Key Reasons:
- NVIDIA's AI chip dominance
- Meta's successful cost cutting
- Eli Lilly's GLP-1 drug success
- Broadcom's VMware acquisition
2024
- 37.1%, $52.6T, +$11.0T
- Changes:
- Added: WMT
- Dropped: LLY
- Key Reasons:
- AI boom driving tech valuations
- Magnificent Seven concentration
- Walmart's retail/digital hybrid success
- Market narrowing to mega-cap tech
Key Trends
- Sector Evolution: Financial → Tech → AI
- Valuation Drivers: Traditional Metrics → Growth → AI Potential
- Market Structure: Diverse → Tech Concentrated
- Business Models: Physical → Digital → Platform
- Innovation Impact: Gradual → Exponential → AI Acceleration